
Fil:High plains fresh groundwater usage 2000.svg

Opprinnelig fil (SVG-fil, standardstørrelse 747 × 946 piksler, filstørrelse: 1,48 MB)
| Denne filen er fra Wikimedia Commons og kan brukes av andre prosjekter. Informasjonen fra filbeskrivelsessiden vises nedenfor. |
Beskrivelse
| Beskrivelse |
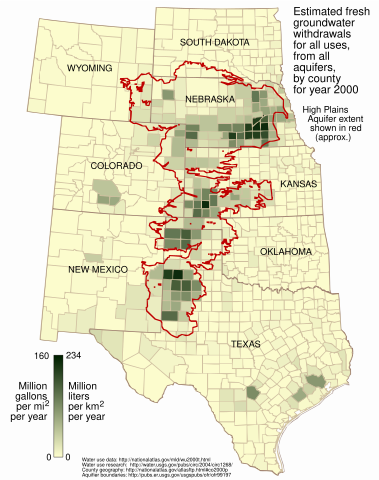
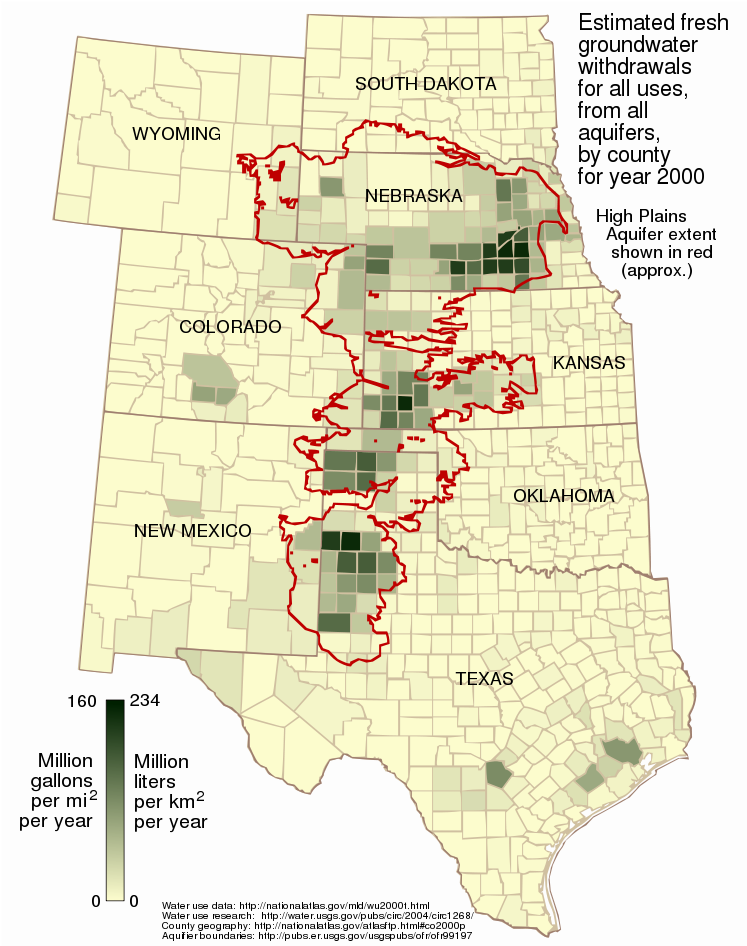
English: This map shows the estimated fresh water usage per square mile in the year 2000 for counties in the eight states underlain in part by the High Plains (Ogallala) Aquifer, presented as million gallons per square mile and million liters per square kilometer.
Usage is for all purposes -- public supply, industrial, irrigation, mining, livestock, and thermoelectric power -- from all underground sources, not just from the Ogallala Aquifer. Water usage data for the year 2000 was taken from the datafile wu2000t.dbf[1] from the US National Atlas[2]. Citation information from the metadata for that file:
Additionally:
The attribute used in this map is described:
The data is supplied as million gallons per day, by county. To arrive at an annual amount per square mile per year, the usage value from wu2000t.dbf was multiplied by 365 and divided by the number of square miles in the county as given in the 2000 county shapefile co2000p020 from the National Atlas:
Aquifer boundaries taken from Fischer and McGuire[3]. The map is presented in a Lambert azimuthal equal-area projection as used in the National Atlas (EPSG:2163[4]), the central meridian and latitude of which align nicely with the aquifer. |
| Dato | |
| Kilde | Eget verk |
| Opphavsperson | Kbh3rd |
| Andre versjoner | File:Ogallala area freshwater ground withdrawals all aquifers.png |
Lisensiering
- Du står fritt:
- til å dele – til å kopiere, distribuere og overføre verket
- til å blande – til å endre verket
- Under de følgende betingelsene:
- navngivelse – Du må kreditere verket på passende vis, lenke til lisensen og indikere hvorvidt det har blitt gjort endringer. Du kan gjøre det på enhver rimelig måte, men ikke på en måte som antyder at lisensgiveren støtter deg eller din bruk av verket.
- del på samme vilkår – Dersom du remikser, omarbeider eller på annen måte bygger på dette verket, må du kun distribuere resultatet under den samme eller en samsvarende lisens som denne.
Filhistorikk
Klikk på et tidspunkt for å vise filen slik den var på det tidspunktet.
| Dato/klokkeslett | Miniatyrbilde | Dimensjoner | Bruker | Kommentar | |
|---|---|---|---|---|---|
| nåværende | 10. mar. 2009 kl. 01:13 | | 747 × 946 (1,48 MB) | Kbh3rd | corrected metric conversion - see talk |
| 3. mar. 2009 kl. 03:28 |  | 747 × 946 (1,48 MB) | Kbh3rd | The map said "acre" while the data, as noted on the image description page, correctly said "square mile". I have fixed that and made some minor esthetic adjustments of the state name locations. | |
| 3. mar. 2009 kl. 01:40 |  | 747 × 946 (1,48 MB) | Kbh3rd | {{Information |Description={{en|1=This map shows the estimated fresh water usage per square mile in the year 2000 for counties in the eight states underlain in part by the High Plains (Ogallala) Aquifer, presented as million milli |
Filbruk
Det er ingen sider som bruker denne filen.
Global filbruk
Følgende andre wikier bruker denne filen:
- Bruk i ar.wikipedia.org
- Bruk i ca.wikipedia.org
- Bruk i ckb.wikipedia.org
- Bruk i en.wikipedia.org
- Bruk i fy.wikipedia.org
- Bruk i kk.wikipedia.org
- Bruk i kw.wikipedia.org
- Bruk i ml.wikipedia.org
- Bruk i pt.wikipedia.org
- Bruk i sr.wikipedia.org
- Bruk i vi.wikipedia.org
- Bruk i www.wikidata.org
- Bruk i zh.wikipedia.org