
Fil:Global temperature relative to peak Holocene temperature, based on ocean cores (NASA).png
Størrelse på denne forhåndsvisningen: 800 × 433 piksler. Andre oppløsninger: 320 × 173 piksler | 640 × 347 piksler | 1 024 × 555 piksler | 1 280 × 693 piksler | 3 486 × 1 888 piksler.
Opprinnelig fil (3 486 × 1 888 piksler, filstørrelse: 193 KB, MIME-type: image/png)
| Denne filen er fra Wikimedia Commons og kan brukes av andre prosjekter. Informasjonen fra filbeskrivelsessiden vises nedenfor. |
.png)
Beskrivelse
| Beskrivelse |
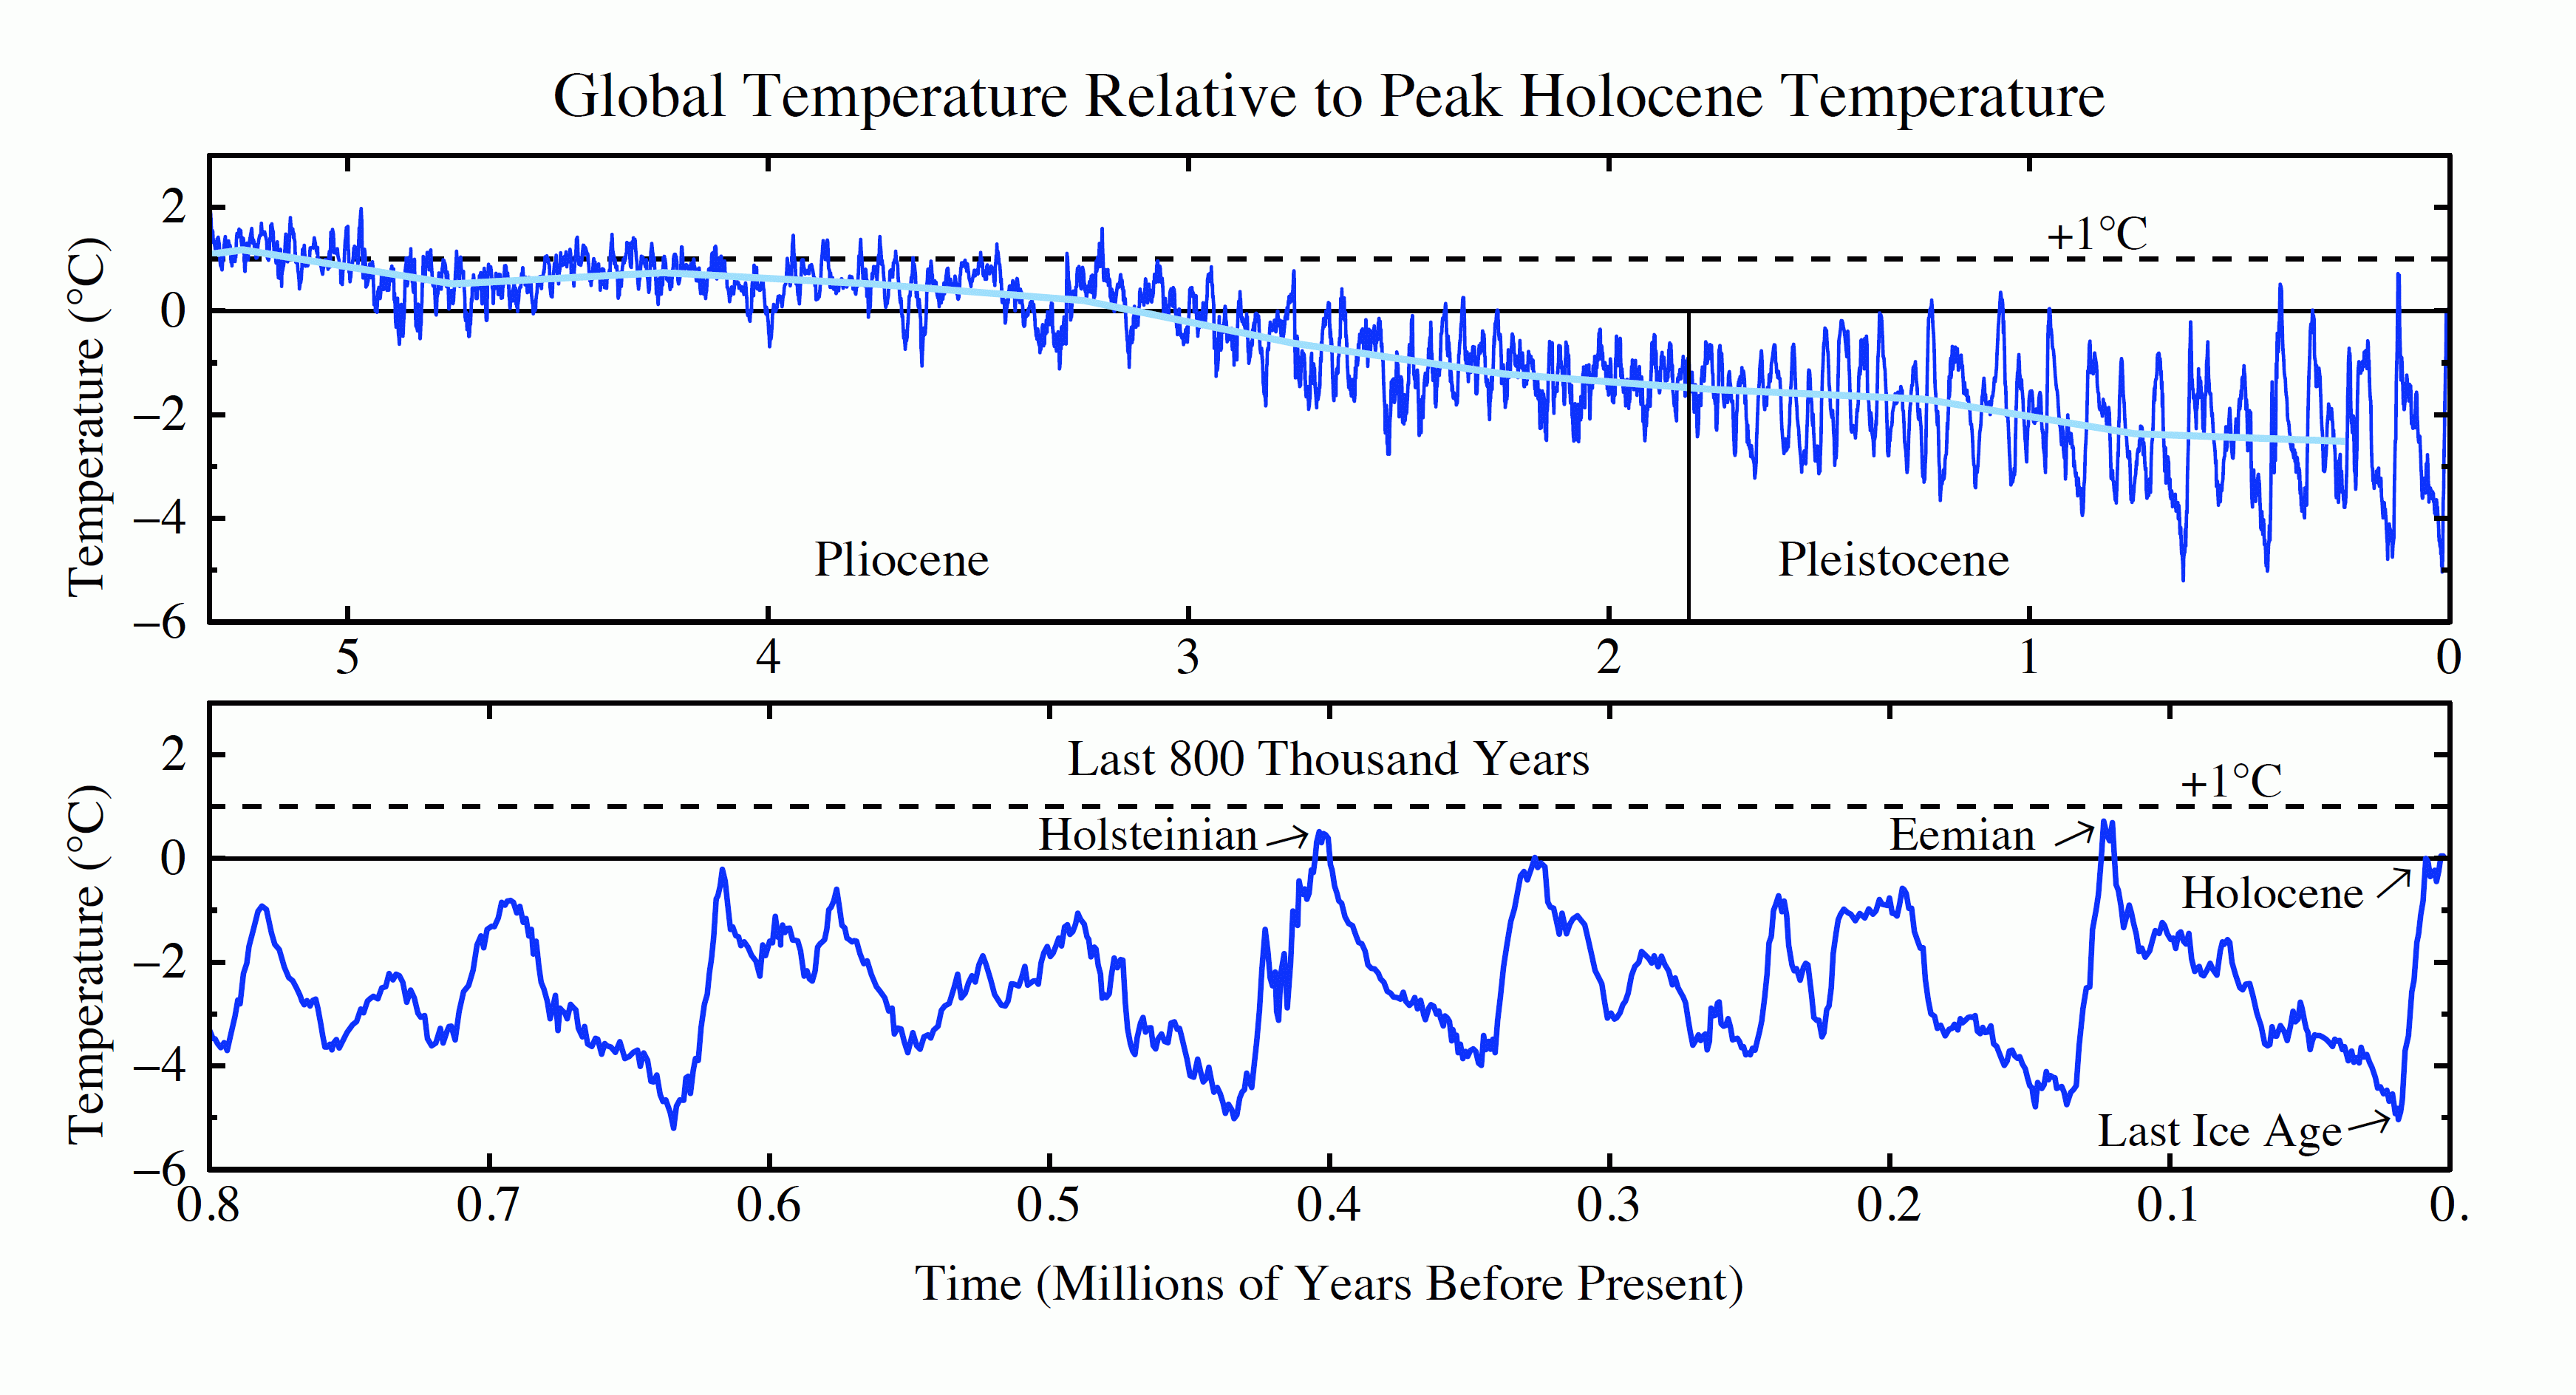
English: These two graphs show global temperatures for two different time periods (Hansen and Sato, 2011). The top graph shows global surface temperature for the past 5.3 million years as inferred from cores of ocean sediments taken all around the global ocean. The last 800,000 years are expanded in the bottom graph. From the cited public-domain source (Hansen and Sato, 2011): "Assumptions are required to estimate global surface temperature change from deep ocean changes, but we argue and present evidence that the ocean core record yields a better measure of global mean change than that provided by polar ice cores. Civilization developed during the Holocene, the interglacial period of the past 10,000 years during which global temperature and sea level have been unusually stable. (This image) shows two prior interglacial periods that were warmer than the Holocene: the Eemian (about 130,000 years ago) and the Holsteinian (about 400,000 years ago). In both periods sea level reached heights at least 4-6 meters (13-20 feet) greater than today. In the early Pliocene (around 3 million years ago) global temperature was no more than 1-2°C warmer than today, yet sea level was 15-25 meters (50-80 feet) higher." |
| Dato | |
| Kilde | fig1.pdf, in: NASA GISS: Science Briefs: Earth's Climate History: Implications for Tomorrow[1], New York City, New York, USA: NASA GISS, (Please provide a date or year), archived from the original on 2011-07-24 |
| Opphavsperson | James E. Hansen and Makiko Sato |
Lisensiering
| This file is in the public domain in the United States because it was solely created by NASA. NASA copyright policy states that "NASA material is not protected by copyright unless noted". (See Template:PD-USGov, NASA copyright policy page or JPL Image Use Policy.) | ||
 |
Warnings:
|
Filhistorikk
Klikk på et tidspunkt for å vise filen slik den var på det tidspunktet.
| Dato/klokkeslett | Miniatyrbilde | Dimensjoner | Bruker | Kommentar | |
|---|---|---|---|---|---|
| nåværende | 20. nov. 2012 kl. 05:14 | | 3 486 × 1 888 (193 KB) | Enescot | {{Information |Description ={{en|1=These two graphs show global temperatures for two different time periods (Hansen and Sato, 2011). The top graph shows global surface temperature for the past 5.3 million years as inferred from cores of ocean [[:en:... |
Filbruk
Den følgende siden bruker denne filen:
Global filbruk
Følgende andre wikier bruker denne filen:
- Bruk i ar.wikipedia.org
- Bruk i de.wikipedia.org
.png)