
Fil:Changes in total solar irradiance and monthly sunspot numbers, 1975-2013.png
Størrelse på denne forhåndsvisningen: 796 × 600 piksler. Andre oppløsninger: 319 × 240 piksler | 637 × 480 piksler | 1 020 × 768 piksler | 1 280 × 964 piksler | 2 318 × 1 746 piksler.
Opprinnelig fil (2 318 × 1 746 piksler, filstørrelse: 289 KB, MIME-type: image/png)
| Denne filen er fra Wikimedia Commons og kan brukes av andre prosjekter. Informasjonen fra filbeskrivelsessiden vises nedenfor. |
Beskrivelse
| Beskrivelse |
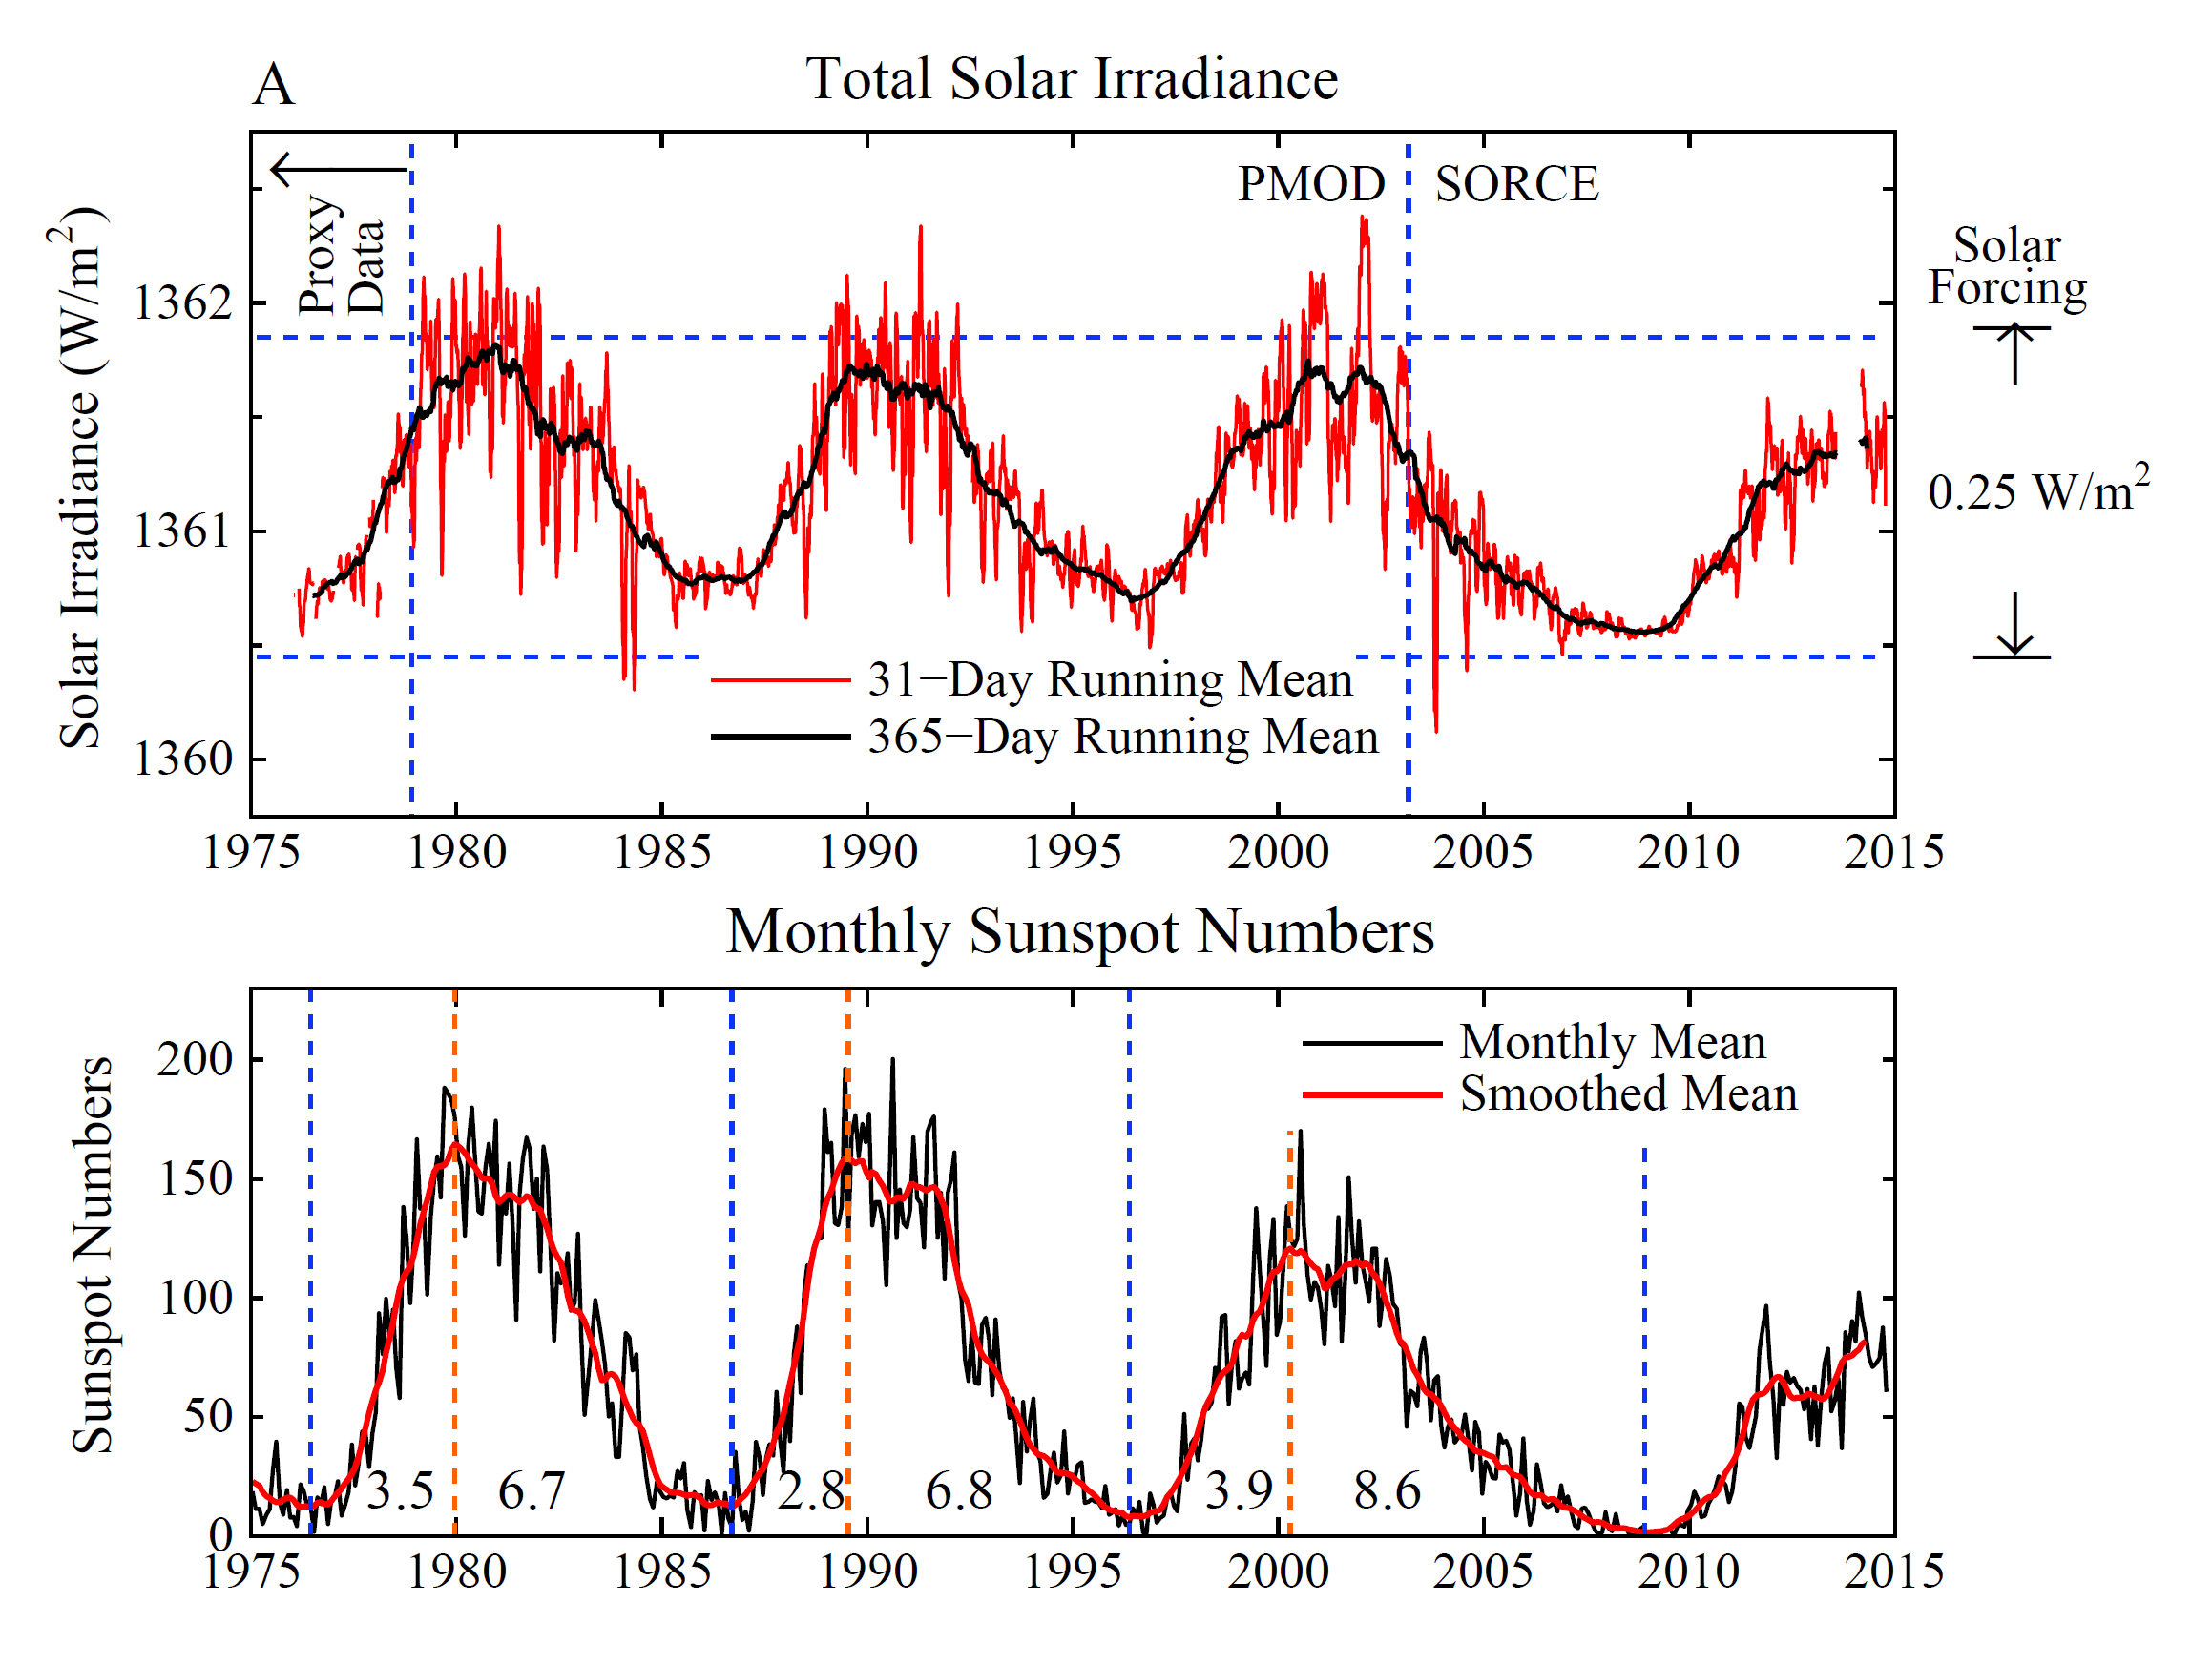
English: These two graphs show changes in total solar irradiance (TSI, labelled "A") and monthly sunspot numbers ("B") between approximately 1975 to 2013. TSI is measured in watts per square metre (W.m-2), with 31-day and 365-day running means plotted. The 31-day mean shows more variability than the 365-day mean. Both curves show a pattern of peaks and troughs (see: solar cycle). The range of changes in solar forcing (365-day mean) over the time period is 0.25 W.m2.
Graph B plots a monthly mean and smoothed mean, with the monthly mean showing more variability than the smoothed mean. The pattern of peaks and troughs in total solar irradiance is replicated in this graph of monthly sunspot numbers. A summary of the data is given in a later section. |
| Dato | |
| Kilde |
|
| Opphavsperson | Hansen J, Kharecha P, Sato M, Masson-Delmotte V, Ackerman F, et al. |
Data
Values are approximate. See Hansen et al. for original data sources. For TSI and monthly sunspot numbers, data are given for the 365-day mean and smoothed mean, respectively. Values are given that correspond to peaks and troughs in the curves, as well as values at the beginning and end of the time period (approximately 1977 and 2014).
| Year | TSI |
|---|---|
| 1977 | 1360.75 |
| 1981 | 1361.85 |
| 1986 | 1360.75 |
| 1991 | 1361.6 |
| 1996 | 1360.75 |
| 2001 | 1361.7 |
| 2009 | 1360.55 |
| 2013 | 1361.35 |
| Year | Sunspot No. |
|---|---|
| 1977 | 15 |
| 1980 | 160 |
| 1987 | 15 |
| 1991 | 145 |
| 1997 | 10 |
| 2001 | 105 |
| 2009 | 3 |
| 2014 | 85 |
Lisensiering
| Denne filen er gjort tilgjengelig under lisensen Creative Commons CC0 1.0 Universal Fristatus-erklæring. | |
| Personen som koblet et verk med dette dokumentet har tilegnet arbeidet til allmennheten ved, i den utstrekning loven tillater det, å avstå fra alle de rettigheter vedkommende skulle hatt ifølge opphavsrettsloven og andre relaterte eller nærliggende juridiske rettigheter. Verk under CC0 krever ikke attributtering. Ved bruk av verket trenger du ikke å få godkjennelse fra opphavspersonen.
|
| Annotations | This image is annotated: View the annotations at Commons |
Filhistorikk
Klikk på et tidspunkt for å vise filen slik den var på det tidspunktet.
| Dato/klokkeslett | Miniatyrbilde | Dimensjoner | Bruker | Kommentar | |
|---|---|---|---|---|---|
| nåværende | 21. nov. 2014 kl. 09:49 | | 2 318 × 1 746 (289 KB) | Enescot | {{Information |Description ={{en|1=These two graphs show changes in total solar irradiance (TSI, labelled "A") and monthly sunspot numbers ("B") between approximately 1975 to 2013. TSI is measured in wa... |
Filbruk
Det er ingen sider som bruker denne filen.
Global filbruk
Følgende andre wikier bruker denne filen:
- Bruk i de.wikipedia.org
- Bruk i es.wikipedia.org
- Bruk i ga.wikipedia.org