
Fil:US Federal Debt as Percent of GDP by President.jpg

Størrelse på denne forhåndsvisningen: 800 × 492 piksler. Andre oppløsninger: 320 × 197 piksler | 640 × 393 piksler | 965 × 593 piksler.
Opprinnelig fil (965 × 593 piksler, filstørrelse: 108 KB, MIME-type: image/jpeg)
| Denne filen er fra Wikimedia Commons og kan brukes av andre prosjekter. Informasjonen fra filbeskrivelsessiden vises nedenfor. |
Beskrivelse
| Beskrivelse |
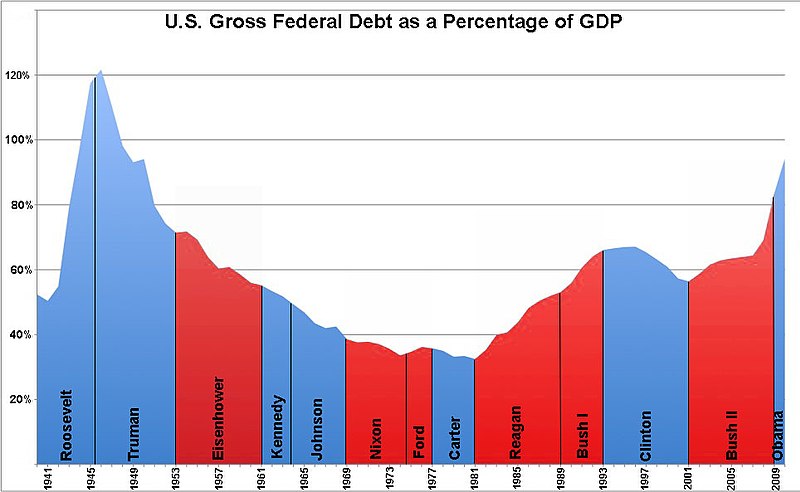
English: This is a graph of U.S. gross federal government debt from 1940 to 2010, as a percentage of GDP, broken down by presidential terms. The data is from the U.S. Office of Management and Budget (http://www.whitehouse.gov/sites/default/files/omb/budget/fy2011/assets/hist07z1.xls).
Replaced by File:US_Federal_Debt_as_Percent_of_GDP_by_President.png |
| Dato | |
| Kilde | Eget verk |
| Opphavsperson | CircleAdrian & Michael Adams |
| Andre versjoner | US_Federal_Debt_as_Percent_of_GDP_by_President.png |

|
En vektorversjon av dette bildet (SVG) er tilgjengelig.
Det bør brukes i stedet for punktgrafikkbildet når det er fordelaktig. File:US Federal Debt as Percent of GDP by President.jpg → File:US Federal Debt as Percent of GDP by President.svg
For mer informasjon om vektorgrafikk les Commons transition to SVG. Se også information about MediaWiki's support of SVG images. |
 |
Lisensiering
| Jeg, opphavsrettensholderen til dette verket, frigir dette verket til allmennheten. Dette gjelder på verdensbasis. I enkelte land kan dette være juridisk umulig. I så fall: Jeg gir hvem som helst retten til å bruke dette verket for ethvert formål, uten noen vilkår, med mindre slike vilkår kreves ved lov. |
Filhistorikk
Klikk på et tidspunkt for å vise filen slik den var på det tidspunktet.
| Dato/klokkeslett | Miniatyrbilde | Dimensjoner | Bruker | Kommentar | |
|---|---|---|---|---|---|
| nåværende | 18. jan. 2011 kl. 07:08 | | 965 × 593 (108 KB) | ResidentScholar~commonswiki | Reverted to version as of 06:04, 7 April 2010 |
| 16. jan. 2011 kl. 12:57 |  | 965 × 593 (75 KB) | ResidentScholar~commonswiki | Corrected Bush and Obama figures. Fiscal years and calendar years may be intermixed elsewhere so further revision may be necessary. In this case 69.5% of GDP is the end-of-Fiscal-year debt figure used by the OMB source; I used 74.5% which is the end-of- | |
| 7. apr. 2010 kl. 08:04 |  | 965 × 593 (108 KB) | CircleAdrian | Increased proportional size of Y-axis, color-coded by presidential term, and took off estimates for dates after 2010 (due to potential inaccuracy). | |
| 1. apr. 2010 kl. 11:29 | 1 405 × 485 (167 KB) | Unquietwiki | This is a graph of U.S. federal government debt from 1940 to 2015, as a percentage of GDP, broken down by year+President. The data is from the U.S. Office of Management and Budget (http://www.whitehouse.gov/omb/budget/fy2011/assets/hist07z1.xls) [[Catego | ||
| 31. mar. 2010 kl. 05:14 |  | 856 × 481 (77 KB) | CircleAdrian | {{Information |Description={{en|1=This is a graph of U.S. federal government debt from 1977 to 2009, as a percentage of GDP, broken down by presidential terms. The data is from the U.S. Office of Management and Budget (http://www.whitehouse.gov/omb/budget |
Filbruk
Den følgende siden bruker denne filen:
Global filbruk
Følgende andre wikier bruker denne filen:
- Bruk i de.wikipedia.org
- Bruk i en.wikipedia.org