
Fil:Temperature1900-2004.png

Størrelse på denne forhåndsvisningen: 800 × 489 piksler. Andre oppløsninger: 320 × 196 piksler | 640 × 391 piksler | 1 024 × 626 piksler | 1 280 × 782 piksler | 1 875 × 1 146 piksler.
Opprinnelig fil (1 875 × 1 146 piksler, filstørrelse: 50 KB, MIME-type: image/png)
| Denne filen er fra Wikimedia Commons og kan brukes av andre prosjekter. Informasjonen fra filbeskrivelsessiden vises nedenfor. |
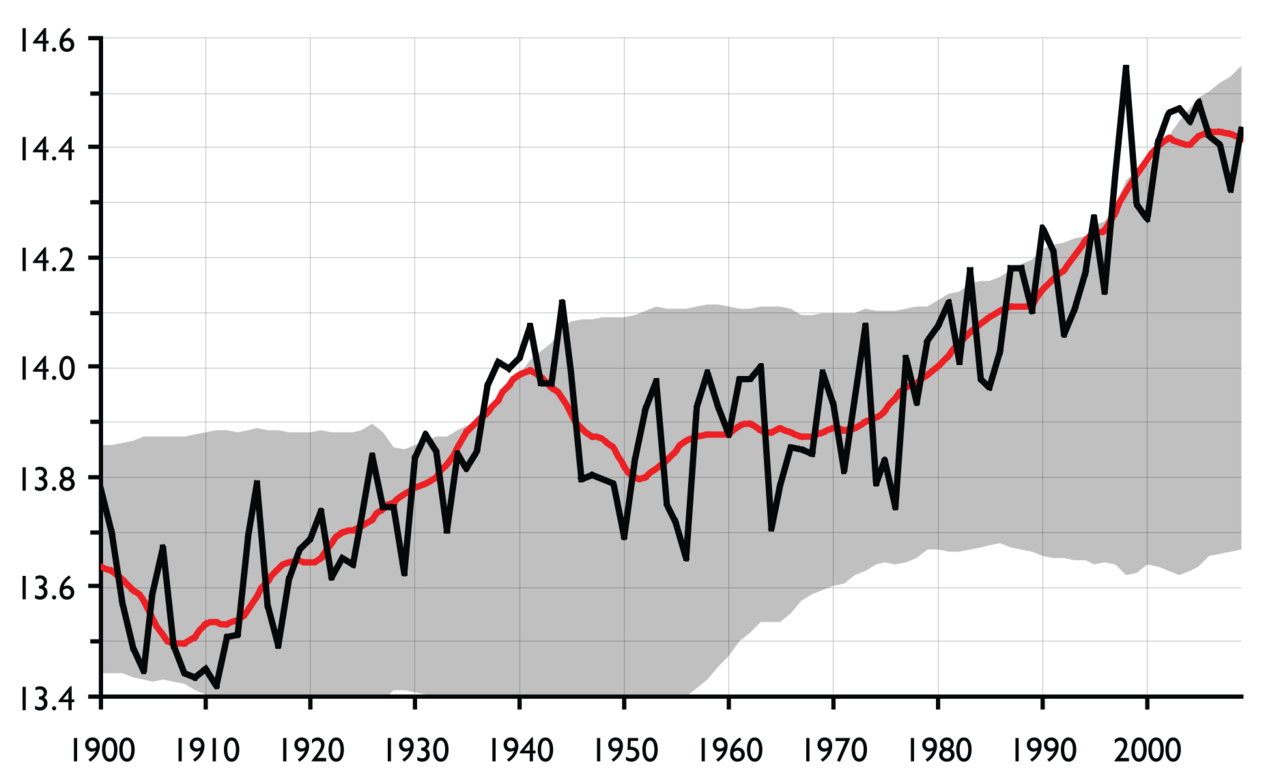
English: Description: Global temperature. Axes are not labelled in order to keep the diagram language neutral; x-axis: year (1900–2009), y-axis: global temperature in °C. The black line is the annual global mean. The red line is the 10-year running mean. The grey area is the 95% confidence interval of the same data, calculated for the 50 years up to and including each year's measurement.
The diagram illustrates several aspects of global warming, the most obvious of which is the increase in mean temperature. However, also the confidence interval has increased both in value (i.e., warmer climate) and in width (i.e., more variable temperature). Periods of rapid change are characterised by many measurements falling outside the confidence intervals. Two such periods can be identified: the late 30's / early 40's, and from the 80's to today. Temperature increase in those periods is due to anthropogenous effects, according to the IPCC.
The diagram illustrates several aspects of global warming, the most obvious of which is the increase in mean temperature. However, also the confidence interval has increased both in value (i.e., warmer climate) and in width (i.e., more variable temperature). Periods of rapid change are characterised by many measurements falling outside the confidence intervals. Two such periods can be identified: the late 30's / early 40's, and from the 80's to today. Temperature increase in those periods is due to anthropogenous effects, according to the IPCC.
Français : Description: Évolution de la température globale planétaire. Les axes ne sont pas étiquetés pour que le graphique reste linguistiquement neutre ; axe des x: année (1900-2009), axe des y: température globale en °C. En noir: moyenne mondiale annuelle. En rouge : moyenne des dix dernières années. Zone grise : intervalle de confiance à 95% des mêmes données (calculé pour les mesures de 50 ans à chaque année).
Le diagramme montre que la température moyenne tend à augmenter, mais avec du "bruit", c'est à dire des variations sur les périodes courtes. Cependant, l’intervalle de confiance a aussi augmenté : en valeur (=> climat plus chaud) et en largeur (=> Température plus variable). Certaines périodes de changement rapide sont caractérisées par de nombreuses mesures situées en dehors des intervalles de confiance. Deux de ces périodes peuvent être identifiées : la fin des années 30 / le début des années 40 et des années 80 à aujourd'hui. L’augmentation de la température pendant ces périodes est due à des effets anthropogènes, selon le GIEC.
- Note: The file name is not "correct" any more, as the graph now ends in 2009 rather than 2004. The estimate for 2009 is based on preliminary values for the first 8 months of the year.
- Source: graph drawn by Hanno using data published on the web (2009) as "HadCRUT3". Met Office Hadley Centre for Climate Change, U.K. [http://www.cru.uea.ac.uk/cru/data/temperature/]
- Licence: released into the public domain by the author
| Jeg, opphavsrettensholderen til dette verket, frigir dette verket til allmennheten. Dette gjelder på verdensbasis. I enkelte land kan dette være juridisk umulig. I så fall: Jeg gir hvem som helst retten til å bruke dette verket for ethvert formål, uten noen vilkår, med mindre slike vilkår kreves ved lov. |

|
Dette bildet bør gjenskapes med hjelp av vektorgrafikk som en SVG-fil. Dette har flere fordeler, se Commons:Media for cleanup for mer informasjon. Hvis en SVG-fil med dette bildet er tilgjengelig, vennligst last den opp. Etter opplasting erstatt denne malen med {{vector version available|nytt bilde.svg}}.
|
Filhistorikk
Klikk på et tidspunkt for å vise filen slik den var på det tidspunktet.
| Dato/klokkeslett | Miniatyrbilde | Dimensjoner | Bruker | Kommentar | |
|---|---|---|---|---|---|
| nåværende | 3. okt. 2016 kl. 00:05 | | 1 875 × 1 146 (50 KB) | Cmdrjameson | Compressed with pngout. Reduced by 116kB (70% decrease). |
| 14. okt. 2009 kl. 20:00 |  | 1 875 × 1 146 (166 KB) | Hanno | * '''Description:''' Global temperature. Axes are not labelled in order to keep the diagram language neutral; ''x''-axis: year (1900–2009), ''y''-axis: global temperature in °C. The black line is the annual global mean. The red line is the 10-year | |
| 9. nov. 2005 kl. 18:39 |  | 1 200 × 780 (120 KB) | Hanno | ||
| 26. okt. 2005 kl. 21:13 |  | 1 200 × 767 (90 KB) | Hanno | ||
| 25. okt. 2005 kl. 13:33 |  | 1 200 × 767 (76 KB) | Hanno |
Filbruk
Det er ingen sider som bruker denne filen.
Global filbruk
Følgende andre wikier bruker denne filen:
- Bruk i es.wikipedia.org
- Bruk i ga.wikipedia.org
- Bruk i hu.wikipedia.org
- Bruk i nn.wikipedia.org