
Fil:Mauna Loa CO2 monthly mean concentration DE.svg

Størrelse for denne PNG-forhåndsvisningen av denne SVG-filen: 600 × 600 piksler Andre oppløsninger: 240 × 240 piksler | 480 × 480 piksler | 768 × 768 piksler | 1 024 × 1 024 piksler | 2 048 × 2 048 piksler | 708 × 708 piksler.
Opprinnelig fil (SVG-fil, standardstørrelse 708 × 708 piksler, filstørrelse: 438 KB)
| Denne filen er fra Wikimedia Commons og kan brukes av andre prosjekter. Informasjonen fra filbeskrivelsessiden vises nedenfor. |
Beskrivelse
| Beskrivelse |
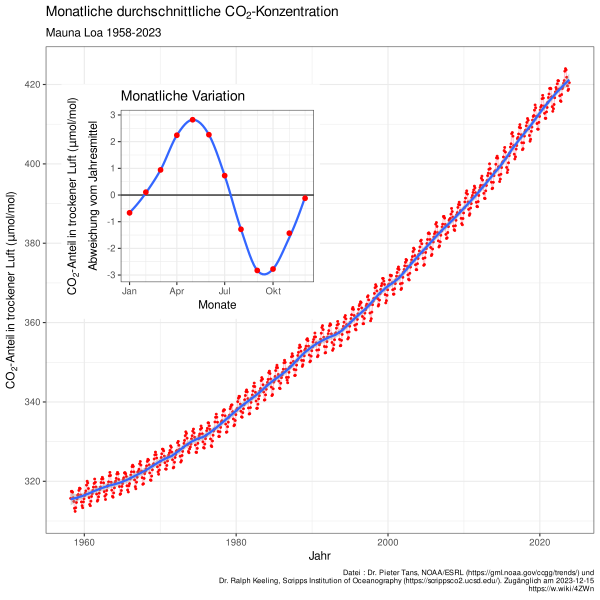
Deutsch: Die Keeling-Kurve ist die graphische Darstellung des mittleren globalen Konzentrationsverlaufs des Spurengases Kohlenstoffdioxid (CO2) in der Erdatmosphäre seit dem Jahr 1958. |
| Dato | |
| Kilde | Eget verk. Data from Dr. Pieter Tans, NOAA/ESRL and Dr. Ralph Keeling, Scripps Institution of Oceanography. |
| Opphavsperson | Oeneis |
| Andre versjoner |
[]
Keeling curve
|


| Kameraposisjon | | Dette og andre bilder på denne posisjonen på: OpenStreetMap |
|---|
Lisensiering
Jeg, rettighetsinnehaver av dette arbeidet, publiserer det herved under følgende lisens:
Denne filen er lisensiert under lisensen Creative Commons Navngivelse-DelPåSammeVilkår 4.0 Internasjonal.
- Du står fritt:
- til å dele – til å kopiere, distribuere og overføre verket
- til å blande – til å endre verket
- Under de følgende betingelsene:
- navngivelse – Du må kreditere verket på passende vis, lenke til lisensen og indikere hvorvidt det har blitt gjort endringer. Du kan gjøre det på enhver rimelig måte, men ikke på en måte som antyder at lisensgiveren støtter deg eller din bruk av verket.
- del på samme vilkår – Dersom du remikser, omarbeider eller på annen måte bygger på dette verket, må du kun distribuere resultatet under den samme eller en samsvarende lisens som denne.
Data source license
These data are made freely available to the public and the scientific community in the belief that their wide dissemination will lead to greater understanding and new scientific insights.
— Pieter Tans, in: NOAA
Create this graph
Denne vektorgrafikken ble laget med R.
R code
# Mauna Loa atmospheric CO2 change
# multi language plot for Wikipedia
# using different possible sources (Scripps if NOAA is not available)
#
# Used for https://commons.wikimedia.org/wiki/File:Mauna_Loa_CO2_monthly_mean_concentration.svg
# and related files in other languages. See all files in :
# https://commons.wikimedia.org/wiki/Template:Other_versions/Mauna_Loa_CO2_monthly_mean_concentration
#
# Update this script on :
# https://commons.wikimedia.org/w/index.php?title=Template:Other_versions/Mauna_Loa_CO2_monthly_mean_concentration.R&action=edit

# Required packages.   used for :
library(readr)         # reading data
library(dplyr)         # data processing
library(ggplot2)       # plot
library(gridExtra)     # plot positionning
library(scales)        # pretty breaks on plot axis
library(lubridate)     # date processing
library(httr)          # check url
library(Hmisc)         # ci from bootstrap

# install all locales beforehand, e.g. :
# sudo locale-gen ca_ES.UTF-8

old_locale <- Sys.getlocale("LC_TIME")

# Translations ------------------------------------------------------------

language <- list(

  ca_ES = list(
    locale_lc_time = "ca_ES.UTF-8",
    title = bquote("Mitjana mensual de la concentratió de"~CO[2]),
    subtitle = "Mauna Loa",
    caption_scripps = paste("dades : R. F. Keeling, S. J. Walker, S. C. Piper and A. F. Bollenbacher\nScripps CO2 Program (https://scrippsco2.ucsd.edu/). Visitada", Sys.Date()),
    caption_noaa = paste("dades : Dr. Pieter Tans, NOAA/ESRL (https://gml.noaa.gov/ccgg/trends/) i\n Dr. Ralph Keeling, Scripps Institution of Oceanography (https://scrippsco2.ucsd.edu/). Visitada ", Sys.Date()),
    x = "any",
    y = bquote("fracció de"~CO[2]~"en aire sec ("*mu*"mol/mol)"),
    x2 = "mes",
    y2 = bquote(atop("fracció de"~CO[2]~"en aire sec ("*mu*"mol/mol)",
                     "desviació de la mitjana anual")),
    title2 = "Variació mensual"
  ),

  cs_CZ = list(
    locale_lc_time = "cs_CZ.UTF-8",
    title = "Průměrné měsíční koncentrace oxidu uhličitého",
    subtitle = "Mauna Loa",
    caption_scripps = paste("data : R. F. Keeling, S. J. Walker, S. C. Piper a A. F. Bollenbacher\nScripps CO2 Program (https://scrippsco2.ucsd.edu/). Přístupné", Sys.Date()),
    caption_noaa = paste("data : Dr. Pieter Tans, NOAA/ESRL (https://gml.noaa.gov/ccgg/trends/) a\nDr. Ralph Keeling, Scripps Institution of Oceanography (https://scrippsco2.ucsd.edu/). Přístupné", Sys.Date()),
    x = "rok",
    y = bquote("koncentrace"~CO[2]~"v suchém vzduchu ("*mu*"mol/mol)"),
    x2 = "měsíc",
    y2 = bquote(atop("koncentrace"~CO[2]~"v suchém vzduchu ("*mu*"mol/mol)", "odchylka od ročního průměru")),
    title2 = "Měsíční změna (průměrná roční odchylka)"
  ),

  de_DE = list(
    locale_lc_time = "de_DE.UTF-8",
    title = bquote("Monatliche durchschnittliche"~CO[2]*"-Konzentration"),
    subtitle = "Mauna Loa",
    caption_scripps = paste("Datei : R. F. Keeling, S. J. Walker, S. C. Piper und A. F. Bollenbacher\nScripps CO2 Program (https://scrippsco2.ucsd.edu/). Zugänglich am", Sys.Date()),
    caption_noaa = paste("Datei : Dr. Pieter Tans, NOAA/ESRL (https://gml.noaa.gov/ccgg/trends/) und\nDr. Ralph Keeling, Scripps Institution of Oceanography (https://scrippsco2.ucsd.edu/). Zugänglich am", Sys.Date()),
    x = "Jahr",
    y = bquote(CO[2]*"-Anteil in trockener Luft ("*mu*"mol/mol)"),
    x2 = "Monate",
    y2 = bquote(atop(CO[2]*"-Anteil in trockener Luft ("*mu*"mol/mol)", "Abweichung vom Jahresmittel")),
    title2 = "Monatliche Variation"
  ),

  en_US = list(
    locale_lc_time = "en_US.UTF-8",
    title = bquote("Monthly mean"~CO[2]~"concentration"),
    subtitle = "Mauna Loa",
    caption_scripps = paste("Data : R. F. Keeling, S. J. Walker, S. C. Piper and A. F. Bollenbacher\nScripps CO2 Program (https://scrippsco2.ucsd.edu/). Accessed", Sys.Date()),
    caption_noaa = paste("Data : Dr. Pieter Tans, NOAA/ESRL (https://gml.noaa.gov/ccgg/trends/) and\n Dr. Ralph Keeling, Scripps Institution of Oceanography (https://scrippsco2.ucsd.edu/). Accessed ", Sys.Date()),
    x = "Year",
    y = bquote(CO[2]~"fraction in dry air ("*mu*"mol/mol)"),
    x2 = "Month",
    y2 = bquote(atop(CO[2]~"fraction in dry air ("*mu*"mol/mol)", "Departure from yearly average")),
    title2 = "Seasonal variation"
  ),

  es_ES = list(
    locale_lc_time = "es_ES.UTF-8",
    title = bquote("Media mensual de la concentración de"~CO[2]),
    subtitle = "Mauna Loa",
    caption_scripps = paste("dato : R. F. Keeling, S. J. Walker, S. C. Piper y A. F. Bollenbacher\nScripps CO2 Program (https://scrippsco2.ucsd.edu/). Visitada", Sys.Date()),
    caption_noaa = paste("dato : Dr. Pieter Tans, NOAA/ESRL (https://gml.noaa.gov/ccgg/trends/) y\nDr. Ralph Keeling, Scripps Institution of Oceanography (https://scrippsco2.ucsd.edu/). Visitada", Sys.Date()),
    x = "Año",
    y = bquote("Fraccion de"~CO[2]~"en aire secco ("*mu*"mol/mol)"),
    x2 = "Mes",
    y2 = bquote(atop("Fraccion de"~CO[2]~"en aire secco ("*mu*"mol/mol)", "Desviación de la media anual")),
    title2 = "Variación mensual"
  ),

  fr_FR = list(
    locale_lc_time = "fr_FR.UTF-8",
    title = bquote("Moyenne mensuelle de la concentration de"~CO[2]),
    subtitle = "Mauna Loa",
    caption_scripps = paste("données : R. F. Keeling, S. J. Walker, S. C. Piper et A. F. Bollenbacher\nScripps CO2 Program (https://scrippsco2.ucsd.edu/). Accédé le", Sys.Date()),
    caption_noaa = paste("données : Dr Pieter Tans, NOAA/ESRL (https://gml.noaa.gov/ccgg/trends/) et\n Dr. Ralph Keeling, Scripps Institution of Oceanography (https://scrippsco2.ucsd.edu/). Accédé le", Sys.Date()),
    x = "année",
    y = bquote("fraction de"~CO[2]~"dans l'air sec ("*mu*"mol/mol)"),
    x2 = "mois",
    y2 = bquote(atop("fraction de"~CO[2]~"dans l'air sec ("*mu*"mol/mol)", "en écart à la moyenne annuelle")),
    title2 = "Variation saisonnière"
  ),

    nl_NL = list(
    locale_lc_time = "nl_NL.UTF-8",
    title = bquote("Maandelijkse gemiddelde"~CO[2]*"-concentratie"),
    subtitle = "Mauna Loa",
    caption_scripps = glue("Gegevens : R. F. Keeling, S. J. Walker, S. C. Piper en A. F. Bollenbacher\nScripps CO2 Program (https://scrippsco2.ucsd.edu/). Geopend {Sys.Date()}"),
    caption_noaa = glue("Gegevens : Dr. Pieter Tans, NOAA/ESRL (https://gml.noaa.gov/ccgg/trends/) en\n Dr. Ralph Keeling, Scripps Institution of Oceanography (https://scrippsco2.ucsd.edu/). Accessed  {Sys.Date()}"),
    x = "Jaar",
    y = bquote(CO[2]*"-fractie in droge lucht ("*mu*"mol/mol)"),
    x2 = "Mannd",
    y2 = bquote(atop(CO[2]*"-fractie in droge lucht ("*mu*"mol/mol)", "Afwijking van jaargemiddelde")),
    title2 = "Seizoensgebonden variatie"
  ),

  nn_NO = list(
    locale_lc_time = "nn_NO.UTF-8",
    title = bquote("Gjennomsnittlig månedlig"~CO[2]*"-konsentrasjon"),
    subtitle = "Mauna Loa",
    caption_scripps = paste("data : R. F. Keeling, S. J. Walker, S. C. Piper og A. F. Bollenbacher\nScripps CO2 Program (https://scrippsco2.ucsd.edu/). Vist", Sys.Date()),
    caption_noaa = paste("data : Dr. Pieter Tans, NOAA/ESRL (https://gml.noaa.gov/ccgg/trends/) og\nDr. Ralph Keeling, Scripps Institution of Oceanography (https://scrippsco2.ucsd.edu/). Vist", Sys.Date()),
    x = "År",
    y = bquote(CO[2]*"-andel i tørr luft ("*mu*"mol/mol)"),
    x2 = "Måned",
    y2 = bquote(atop(CO[2]*"-andel i tørr luft ("*mu*"mol/mol)",
                     "Avvik fra årlig gjennomsnitt")),
    title2 = "Årlig variasjon"
  ),

  pl_PL = list(
    locale_lc_time = "pl_PL.UTF-8",
    title = bquote("Średnie miesięczne stężenie"~CO[2]),
    subtitle = "Mauna Loa",
    caption_scripps = paste("Dane : R. F. Keeling, S. J. Walker, S. C. Piper i A. F. Bollenbacher\nScripps CO2 Program (https://scrippsco2.ucsd.edu/). Dostęp na", Sys.Date()),
    caption_noaa = paste("Dane : Dr. Pieter Tans, NOAA/ESRL (https://gml.noaa.gov/ccgg/trends/) i\nDr. Ralph Keeling, Scripps Institution of Oceanography (https://scrippsco2.ucsd.edu/). Dostęp na", Sys.Date()),
    x = "Rok",
    y = bquote("Frakcja"~CO[2]~"w suchym powietrzu ("*mu*"mol/mol)"),
    x2 = "Miesiąc",
    y2 = bquote(atop("Frakcja"~CO[2]~"w suchym powietrzu ("*mu*"mol/mol)", "Odejście od średniej rocznej")),
    title2 = "Wahania sezonowe"
  ),

  ro_RO = list(
    locale_lc_time = "ro_RO.UTF-8",
    title = bquote("Concentrația medie lunară de"~CO[2]),
    subtitle = "Mauna Loa, Hawaii",
    caption_scripps = paste("Date: R. F. Keeling, S. J. Walker, S. C. Piper și A. F. Bollenbacher\nScripps CO2 Program (https://scrippsco2.ucsd.edu/). Accesat în", Sys.Date()),
    caption_noaa = paste("Date : Dr. Pieter Tans, NOAA/ESRL (https://gml.noaa.gov/ccgg/trends/) și\n Dr. Ralph Keeling, Scripps Institution of Oceanography (https://scrippsco2.ucsd.edu/). Accesat în", Sys.Date()),
    x = "An",
    y = bquote("Ponderea"~CO[2]~"în aer uscat ("*mu*"mol/mol)"),
    x2 = "Lună",
    y2 = bquote(atop("Abaterea cotei"~CO[2]~"în aer uscat ("*mu*"mol/mol)", "Abatere de la media anuală")),
    title2 = "Variație sezonieră"
  ),

  ru_RU = list(
    locale_lc_time = "ru_RU.UTF-8",
    title = bquote("Среднемесячная и среднегодовая концентрации"~CO[2]),
    subtitle = "Мауна Лоа, Гаваи",
    caption_scripps = paste("данные : R. F. Keeling, S. J. Walker, S. C. Piper и A. F. Bollenbacher\nScripps CO2 Program (https://scrippsco2.ucsd.edu/). доступ на", Sys.Date()),
    caption_noaa = paste("данные : Dr. Pieter Tans, NOAA/ESRL (https://gml.noaa.gov/ccgg/trends/) и\nDr. Ralph Keeling, Scripps Institution of Oceanography (https://scrippsco2.ucsd.edu/). доступ на ", Sys.Date()),
    x = "Годы",
    y = bquote("Доля"~CO[2]~"в сухом воздухе ("*mu*"mol/mol)"),
    x2 = "Месяцы",
    y2 = bquote(atop("Отклонение доли"~CO[2]~"в сухом воздухе", "от среднегодового значения, мкмоль/моль")),
    title2 = "Сезонные колебания"
  )

)


# Data --------------------------------------------------------------------

# First try NOAA data, if not availble use Scripps data
if (!http_error("ftp://aftp.cmdl.noaa.gov/products/trends/co2/co2_mm_mlo.txt")) {
  # https://gml.noaa.gov/ccgg/trends/data.html
  source <- "noaa"
  co2ml <- read_table(
    "ftp://aftp.cmdl.noaa.gov/products/trends/co2/co2_mm_mlo.txt",
    col_names = c("year", "month", "decimal", "average", "deseason", "ndays", "stddays", "unc"),
    col_types = "iidddidd",
    na = c("-99.99", "-1"),
    comment = "#") %>%
    group_by(year) %>%
    mutate(year_mean = mean(average, na.rm = TRUE),
           delta = average - year_mean,
           vdate = ymd(paste0("2015-", month, "-01")))%>%
    rename(co2 = average)

} else {
  # https://scrippsco2.ucsd.edu/data/atmospheric_co2/primary_mlo_co2_record
  # used during US gov shutdown
  source <- "scripps"
  co2ml <- read_csv(
    "https://scrippsco2.ucsd.edu/assets/data/atmospheric/stations/in_situ_co2/monthly/monthly_in_situ_co2_mlo.csv",
    col_names = c("year", "month", "xls_date", "decimal",
                  "co2_raw", "co2_raw_seas_adj", "fit", "fit_seas_adj",
                  "co2_filled", "co2_filled_seas_adj"),
    col_types = "iiiddddddd",
    skip = 57,
    na = "-99.99",
    comment = "\"") %>%
    group_by(year) %>%
    mutate(year_mean = mean(co2_filled, na.rm = TRUE),
           delta = co2_filled - year_mean,
           vdate = ymd(paste0("2015-", month, "-01"))) %>%
    rename(co2 = co2_filled)
}


# Generate the plot for each language -------------------------------------

for (l in names(language)) {
  message(l)
  current <- language[[l]]

  # format the date in local names
  Sys.setlocale("LC_TIME", current$locale_lc_time)

  # main plot
  p1 <- ggplot(co2ml, aes(decimal, co2)) +
    geom_line(color = "pink") +
    geom_point(color = "red", size = 0.6) +
    stat_smooth(span = 0.1) +
    scale_x_continuous(breaks = pretty_breaks()) +
    scale_y_continuous(breaks = pretty_breaks()) +
    labs(x = current$x,
         y = current$y,
         title = current$title,
         subtitle = paste(current$subtitle, min(co2ml$year), "-", max(co2ml$year)),
         caption = paste(current[[paste0("caption_", source)]],
                         "https://w.wiki/4ZWn", sep = "\n")) +
    theme_bw() +
    theme(plot.caption = element_text(size = 7))

  # inset plot
  p2 <- ggplot(co2ml, aes(vdate, delta)) +
    geom_hline(yintercept = 0) +
    stat_smooth(span = 0.4, se = FALSE) +
    stat_summary(fun.data = "mean_cl_boot", colour = "red", size = 0.3) +
    scale_x_date(breaks = pretty_breaks(4),
                 minor_breaks = pretty_breaks(12),
                 labels = date_format("%b")) +
    labs(x = current$x2,
         y = current$y2,
         title = current$title2) +
    theme_bw()

  # merge the plots and export in SVG
  p1 + annotation_custom(grob = ggplotGrob(p2),
                         xmin = 1957, xmax = 1991, ymin = 361, ymax = 420)

  ggsave(file = paste("co2_mauna_loa", l, Sys.Date(), "wp.svg", sep = "_"),
         width = 20,
         height = 20,
         units = "cm",
         device = svg)
}

# return to former locale
Sys.setlocale("LC_TIME", old_locale)
Filhistorikk
Klikk på et tidspunkt for å vise filen slik den var på det tidspunktet.
| Dato/klokkeslett | Miniatyrbilde | Dimensjoner | Bruker | Kommentar | |
|---|---|---|---|---|---|
| nåværende | 15. des. 2023 kl. 21:48 | | 708 × 708 (438 KB) | Oeneis | update 2023 |
| 22. des. 2022 kl. 19:31 |  | 708 × 708 (432 KB) | Oeneis | 2022 update | |
| 15. aug. 2022 kl. 10:29 |  | 708 × 708 (432 KB) | Oeneis | update with 2022 data | |
| 16. des. 2021 kl. 23:59 |  | 708 × 708 (428 KB) | Oeneis | update URLs | |
| 16. des. 2021 kl. 21:43 |  | 708 × 708 (425 KB) | Oeneis | 2021 data | |
| 31. okt. 2020 kl. 21:35 |  | 708 × 708 (424 KB) | Oeneis | Update data 2020-10-31 | |
| 20. jul. 2019 kl. 16:44 |  | 708 × 708 (414 KB) | Oeneis | data up to 2019-06 | |
| 6. jan. 2019 kl. 13:11 |  | 708 × 708 (411 KB) | Oeneis | 2018 Datei | |
| 20. jan. 2018 kl. 15:52 |  | 708 × 708 (380 KB) | Oeneis | 1958-2017 data | |
| 8. okt. 2017 kl. 17:12 |  | 708 × 708 (379 KB) | Oeneis | typo |
Filbruk
Det er ingen sider som bruker denne filen.
Global filbruk
Følgende andre wikier bruker denne filen:
- Bruk i de.wikipedia.org
- Klimawandelleugnung
- Kohlenstoffdioxid
- Charles David Keeling
- Roger Revelle
- Messstation Mauna Loa
- Keeling-Kurve
- CO2-Budget
- EU-Emissionshandel
- CO2-Steuer
- Losing Earth
- Wikipedia Diskussion:Hauptseite/Artikel des Tages/Archiv/Vorschläge/2019/Q4
- Benutzer:Klimafix
- Wikipedia Diskussion:Hauptseite/Artikel des Tages/Archiv/Vorschläge/2020/Q3
- Wikipedia:Hauptseite/Archiv/25. September 2020
- Wikipedia Diskussion:Hauptseite/Jahrestage/Archiv/2023
- Bruk i de.wiktionary.org
- Bruk i www.wikidata.org