
Fil:Logarithmic functions.svg

Størrelse for denne PNG-forhåndsvisningen av denne SVG-filen: 600 × 480 piksler Andre oppløsninger: 300 × 240 piksler | 960 × 768 piksler | 1 280 × 1 024 piksler | 2 560 × 2 048 piksler.
Opprinnelig fil (SVG-fil, standardstørrelse 600 × 480 piksler, filstørrelse: 27 KB)
| Denne filen er fra Wikimedia Commons og kan brukes av andre prosjekter. Informasjonen fra filbeskrivelsessiden vises nedenfor. |
Beskrivelse
| Beskrivelse |
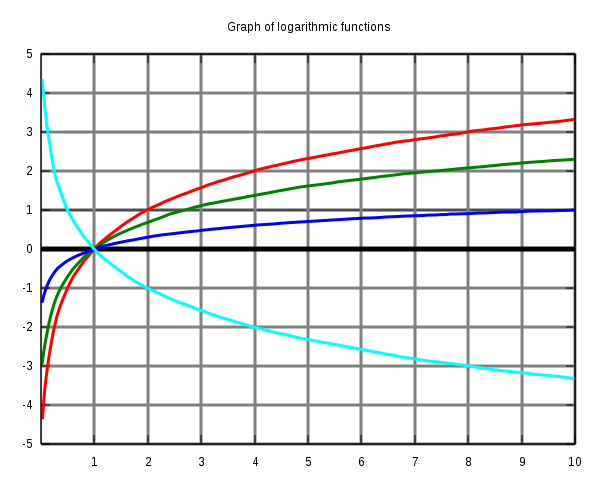
Graph of logarithmic functions in SVG-format. Red is log(x) base 2. Green is ln(x) (log(x) base e). Blue is log(x) base 10. Cyan is log(x) base 0.5.
set terminal svg set output "logarithm.svg" set title "Graph of logarithmic functions" set xrange [0:10] set yrange [-5:5] set xtics 1,1,10 set ytics -5,1,5 set grid linewidth 3 set xzeroaxis linewidth 5 plot log10(x)/log10(2) notitle with lines linewidth 3, log(x) notitle with lines linewidth 3, log10(x) notitle with lines linewidth 3, log10(x)/log10(0.5) notitle with lines linewidth 3 show output |
| Dato | |
| Kilde | Eget verk |
| Opphavsperson | Christoffer Stausland |
Lisensiering
Jeg, rettighetsinnehaver av dette arbeidet, publiserer det herved under følgende lisenser:

|
Det tillates at dette dokumentet kopieres, distribueres og/eller modifiseres under retningslinjene som beskrevet i GNU fri dokumentasjonslisens, versjon 1.2 eller senere utgave utgitt av Free Software Foundation; med alle seksjoner, uten noen forsidetekster og baksidetekster. En kopi av lisensen er inkludert i avsnittet GNU Free Documentation License. |
| Denne filen er lisensiert under lisensen Creative Commons Navngivelse-DelPåSammeVilkår 3.0 Unported | ||
| ||
| Dette lisensmerket ble lagt til filen som del av lisensoppdateringen av GFDL. |
Denne filen er lisensiert under lisensene Creative Commons Navngivelse-DelPåSammeVilkår 2.5 Generisk, 2.0 Generisk og 1.0 Generisk.
- Du står fritt:
- til å dele – til å kopiere, distribuere og overføre verket
- til å blande – til å endre verket
- Under de følgende betingelsene:
- navngivelse – Du må kreditere verket på passende vis, lenke til lisensen og indikere hvorvidt det har blitt gjort endringer. Du kan gjøre det på enhver rimelig måte, men ikke på en måte som antyder at lisensgiveren støtter deg eller din bruk av verket.
- del på samme vilkår – Dersom du remikser, omarbeider eller på annen måte bygger på dette verket, må du kun distribuere resultatet under den samme eller en samsvarende lisens som denne.
Du kan velge lisens etter eget valg.
Filhistorikk
Klikk på et tidspunkt for å vise filen slik den var på det tidspunktet.
| Dato/klokkeslett | Miniatyrbilde | Dimensjoner | Bruker | Kommentar | |
|---|---|---|---|---|---|
| nåværende | 11. apr. 2007 kl. 15:22 | | 600 × 480 (27 KB) | Chrtsta | == Summary == {{Information |Description= Graph of logarithmic functions in SVG-format. Red is log(x) base 1.7. Green is log(x) base 2. Blue is ln(x) (log(x) base e). Cyan is log(x) base 0.5. I made this graph in gnuplot (post-processed using Inkscape) |
| 27. mar. 2007 kl. 01:24 |  | 597 × 396 (29 KB) | Dicklyon | Improve it by hand. Use base 10 in place of base 1.7. | |
| 17. mar. 2007 kl. 16:32 |  | 600 × 480 (25 KB) | Chrtsta | == Summary == {{Information |Description= Graph of logarithmic functions in SVG-format. Red is log(x) base 1.7. Green is log(x) base 2. Blue is ln(x) (log(x) base e). Cyan is log(x) base 0.5. I made this graph in gnuplot (it is post-processed using Ink | |
| 16. mar. 2007 kl. 22:40 |  | 600 × 480 (18 KB) | Chrtsta | Graph of logarithmic functions Red is log(x) base 1.7. Green is log(x) base 2. Blue is ln(x) (log(x) base e). Cyan is log(x) base 0.5. I made this graph in gnuplot, with these instructions: set terminal svg set output "logarithm.svg" set title "Graph o |
Filbruk
Den følgende siden bruker denne filen:
Global filbruk
Følgende andre wikier bruker denne filen:
- Bruk i fi.wiktionary.org
- Bruk i nn.wikipedia.org
- Bruk i pl.wikipedia.org